Technical indicators play a very important role: they calculate something and visualize it in the trading software thus saving a trader’s time. Moving Average is a classic indicator and one of the most helpful ones as well. In this article, we’ll see how a MA works and how to use it to improve trading results. Now Moving Average is available in Wealth World Market Trader App.
What’s a Moving Average?
The essence of the indicator is in its name. First, a MA shows the average price for a period you choose. If you choose the ‘50’ period on a daily timeframe, the line will show you the average price for the last 50 days. As life goes on and new days arrive without a stop, the ‘last 50 days’ period is ‘moving’ forward. New dots appear on the chart forming a line – 50-day Moving Average.
How to use Moving Averages in trading?
MA is an invaluable tool. There are two ways how will help you make competent trade decisions:
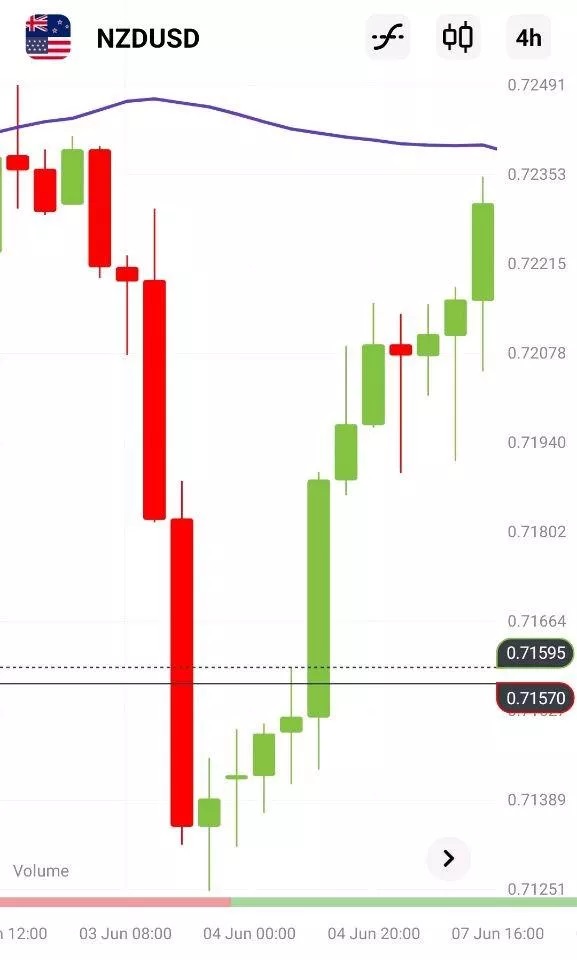
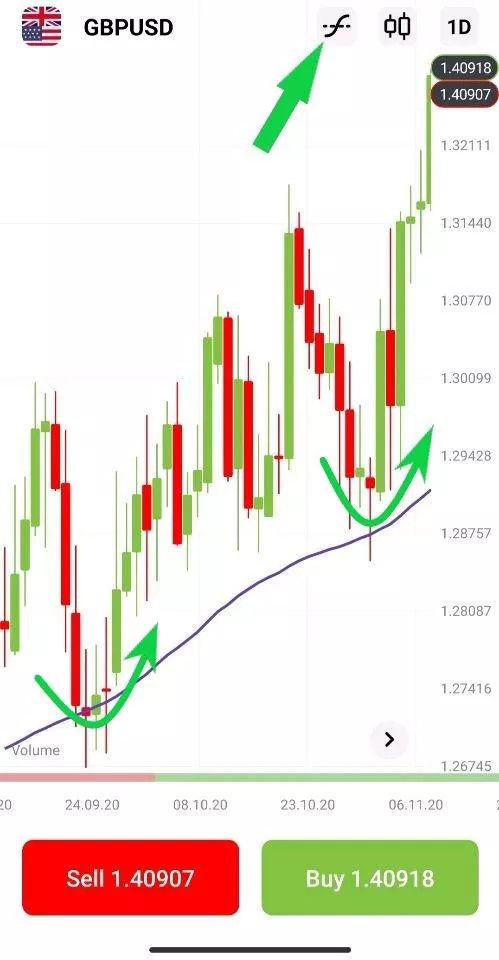
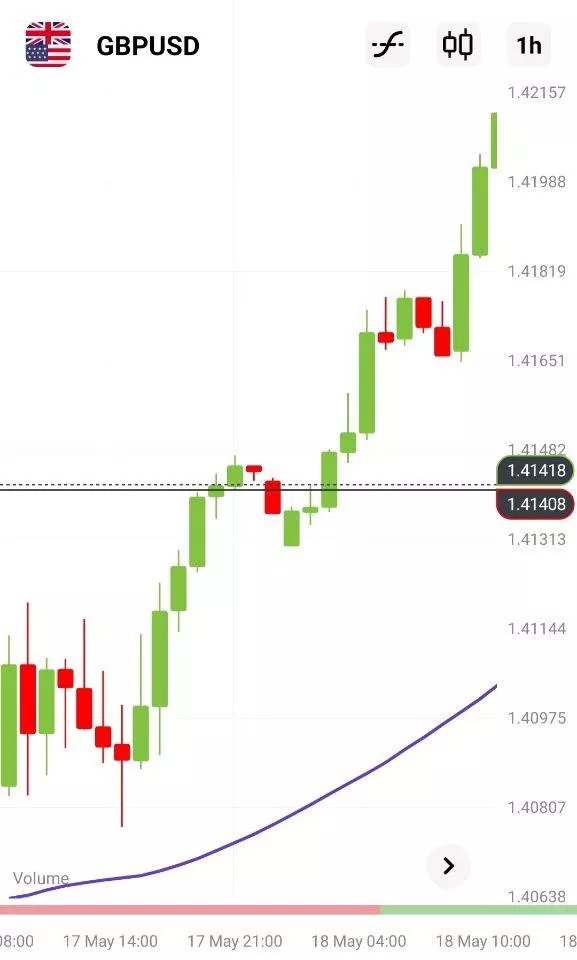
- When the price trend isn’t clear, MA will show it to you. If the MA goes up, it’s an uptrend. If the indicator goes down, it’s a downtrend. It’s that simple.
- You can use MAs as support and resistance. If the price comes close to a MA from the upside, the odds are that the line will make it pause on its way down or even reverse up. If the price rises toward a MA from the downside, the odds are that the line will make it pause on its way up or even reverse down. Just add MAs to the chart and you’ll have your automatic support and resistance.
 Which settings to choose?
 Which settings to choose?
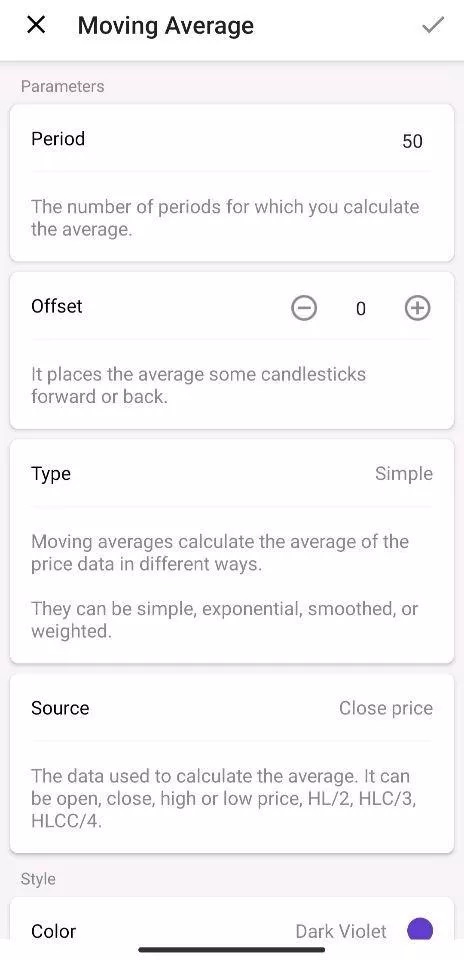
 The indicator has two key parameters: type and period.
Type. If you want a classic line that shows the average price, choose Simple Moving Average (SMA) applied to close prices. If you want your MA to assign a bigger weight to the most recent prices (i.e. focus on the most recent price moves), choose an Exponential Moving Average (EMA). If your goal is to eliminate random moves of the price, which are not important and only distract us, choose smoothed MA. This type of MA is perfect for defining a trend.
Period. The smaller the period, the closer the MA will be to the price. A Moving Average with the period ‘1’ is literally the price itself. The bigger the period, the less the MA follows the particular moves of the price. We recommend you change periods of your MA to see how the line changes. For daily, weekly, and monthly timeframes, traders usually prefer such periods as 50, 100, and 200. For timeframes like H1 and lower, the popular MA periods are 9, 12, and 26.
Trading strategies with Moving Averages
Now the best part – strategies! Trading strategies provide you with the ready set of rules to enter and exit the market. You just need to follow the steps carefully. Remember that it’s always better to test a strategy in a demo account first.
Strategy #1: The Three Timeframes
- Add 60 SMA to the chart. It’s recommended to use M5, H1, and H4 timeframes of EUR/USD or GBP/USD.
- Check the biggest timeframe (H4). If the current price is above 60 SMA, consider opening a buy trade. If the current price is below 60 SMA, consider opening a sell trade.
- Check the next timeframe (H1). If there was a buy signal on H4, here the current price should be above 60-period SMA as well. If there was a sell signal on H4, here the current price on H1 should be below 60-period SMA as well.
- Check the final timeframe (M5). Look for a crossover between the price and 60 SMA. If you are looking for a buying opportunity, wait for the price to cross 60 SMA to the upside. If you want to sell, wait for the price to cross 60 SMA to the downside. If you want to be 100% sure, wait when the price breaks the closest local high/low.
- Place a Take Profit order near the previous highs/lows, or trail your Stop Loss and follow the direction of the price.

Strategy #2: Return to the Average
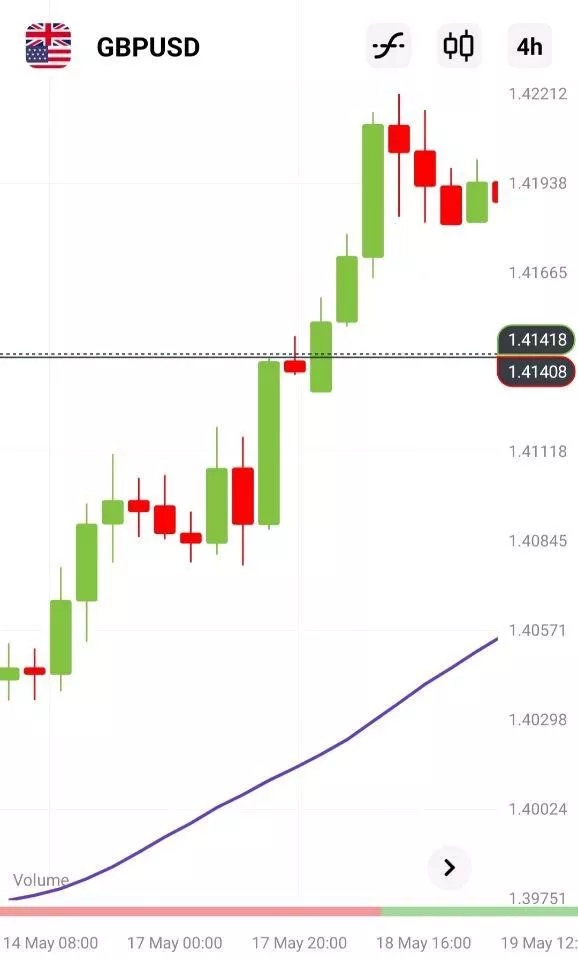
- Use SMA 50 or EMA 50 on a timeframe you like best.
- The price always tends to return to the average price, so look for periods when the price gets too far from the MA relative to other periods on the chart.
- When you’ve noticed that the distance between the price and the MA has become too big, look for reversal candlestick patterns, in particular pin bars (candlesticks with a small body and one long lower/upper shadow), such as Hammer or Shooting Star. Enter the market in the direction of the signal.