What does the RSI tell?
The relative strength index (RSI) is an indicator used in technical analysis to measure the momentum of recent price changes. It helps traders to see whether a stock, a currency pair, or other asset is overbought or oversold. The RSI is presented as an oscillator (a line chart that moves between two extremes) and can have a reading from 0 to 100.
The standard is to use 14 periods to calculate the initial RSI value. The RSI will rise as the number and size of positive closes increase, and it will fall as the number and size of negative closes increase.
Interpretation of the RSI ranges
Generally, when the RSI crosses the horizontal 30 reference level from below, it is a bullish sign, and when it slides below the horizontal 70 reference level, it is a bearish sign. Put another way, one can interpret that RSI values of 70 or above indicate an asset is overbought or overvalued and may be primed for a trend reversal or corrective price pullback. An RSI of 30 or below indicates an oversold or undervalued condition.
During trends, the RSI may fall into a band or range. During an uptrend, the RSI tends to stay above 30 and should frequently hit 70. During a downtrend, it is rare to see the RSI exceed 70, and the indicator frequently hits 30 or below. These guidelines can help determine trend strength and spot potential reversals. For example, if the RSI can’t reach 70 on several consecutive price swings during an uptrend, but then drops below 30, the trend has weakened and could be reversing down.
On the contrary, if the downtrend is unable to reach 30 or below and then rallies above 70 it means that the downtrend has weakened and could be reversing to the upside. Trend lines and moving averages can also help with the analysis.
Best trading techniques with the RSI
The RSI is a multifunctional indicator. It presents not the only price over/undervaluation but can provide traders with many signals, such as divergence and patterns.
Let’s dive into an example and figure out what is the best way to use this oscillator.
Divergence
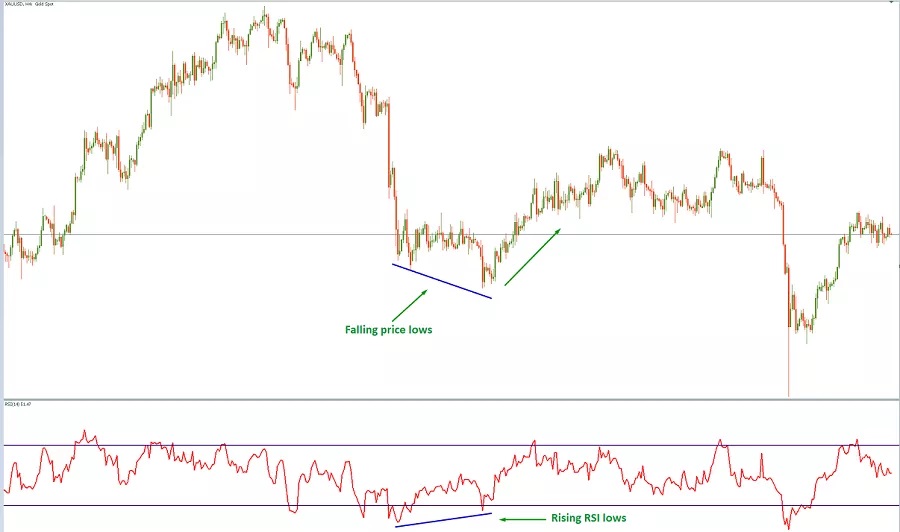
A bullish RSI divergence occurs when the indicator forms higher lows, but, at the same time, the price shows lower minimums. This indicates rising bullish momentum. A break above oversold territory can be used to trigger a long new position.
A bearish RSI divergence occurs when the indicator forms lower highs, but, at the same time, the price shows higher maximums.
The moment when the first green bar appears and the divergence is confirmed, a trader may open a trade with a Stop Loss under a recent low.
Swing Rejections

Another trading technique examines the RSI’s behavior when it is reemerging from overbought or oversold territory. The typical swing rejection consists of 4 parts.
- The RSI gets lower (in this case) than 30.
- The RSI returns above 30.
- The RSI forms another dip without getting below 30.
- The RSI breaks through the most recent high.
The moment of breakout is the trader’s entry point. Stop-loss sets under the recent low.
Accumulation

When a price is staying in the range and RSI moves inside a channel, it means that investors (traders) accumulate powers for the next move. Usually, during these moments, the RSI gets into the 40-60 range and after that, a channel gets broken and massive movements begin.
Patterns

Another great thing about RSI is that patterns work as usual. On the chart above traders couldn’t notice the trend reversal according to the price action, but the “Head with Shoulders” pattern appeared on the RSI. As soon as the RSI line crossed the shoulder line the price went down.
Conclusion
- The RSI compares bullish and bearish price momentum and shows a result on the oscillator below a price chart.
- The RSI could be used to predict the end of correction during a trend.
- It could be used on the biggest time frames for defying trend reversal.
- During a flat market, it might be used as a signal of bulls/bears power accumulation.
- RSI patterns work as usual ones.